

Coalesce 2022: Top 3 Takeaways
How much progress have we made?

Coalesce, WOW. Dbt labs set the bar incredibly high for future data conferences to come. Great people, great place, great conversations. This is without mentioning the great events, great music and great food.
Last week was intense, to say the least. You probably haven’t missed dbt’s product announcements: the addition of Python language support and the dbt Semantic Layer. If you did miss these, here’s a great post by Matt Rittman about dbt’s announcements.
Analytics engineering was also a hot topic. Kevin from Metaplane did an amazing job at summarizing the talks around the purple people and how to build a career as one.
Coalesce also did a great job at bringing the community one step forward in terms of the key challenges and innovations we’ve been trying to tackle as an ecosystem. This article seeks to bring to light what we have achieved in terms of our collective reflection around Data Teams, Data Governance, and Data Apps; three big challenges and innovation areas for our ecosystem.
These topics were the subject of many keynotes. It doesn’t come as a surprise. Data Teams are an evolving thing and the ecosystem is still trying to grasp best practices in terms of structure and performance measurement. Data Governance is becoming a priority for many organizations, as the only solution to bring some clarity to the data creation frenzy. Finally, Data Apps are a long-awaited initiative to democratize the data warehouse. Without a doubt, we took the conversation to the next level on each of these topics last week. In this post, I’ve tried to transmit what this next level looks like.
Before diving in. I wanted to thank all the speakers. All the talks delivered a huge amount of relevant information, in a structured and concise manner. I can’t tell you how much I appreciate the ability to make it short, simple, and straight to the point. I didn’t get bored once. I encourage anyone to re-watch these gems. You won’t be wasting your time. For those who don’t, here’s this article. So, without further ado, let’s get started.
Data teams
Data teams were a widely covered topic during the conference. No wonder. We still don’t have rock-solid best practices for building data teams and measuring their ROI. I attended talks that covered these two topics, learning from the experience of great data leaders.
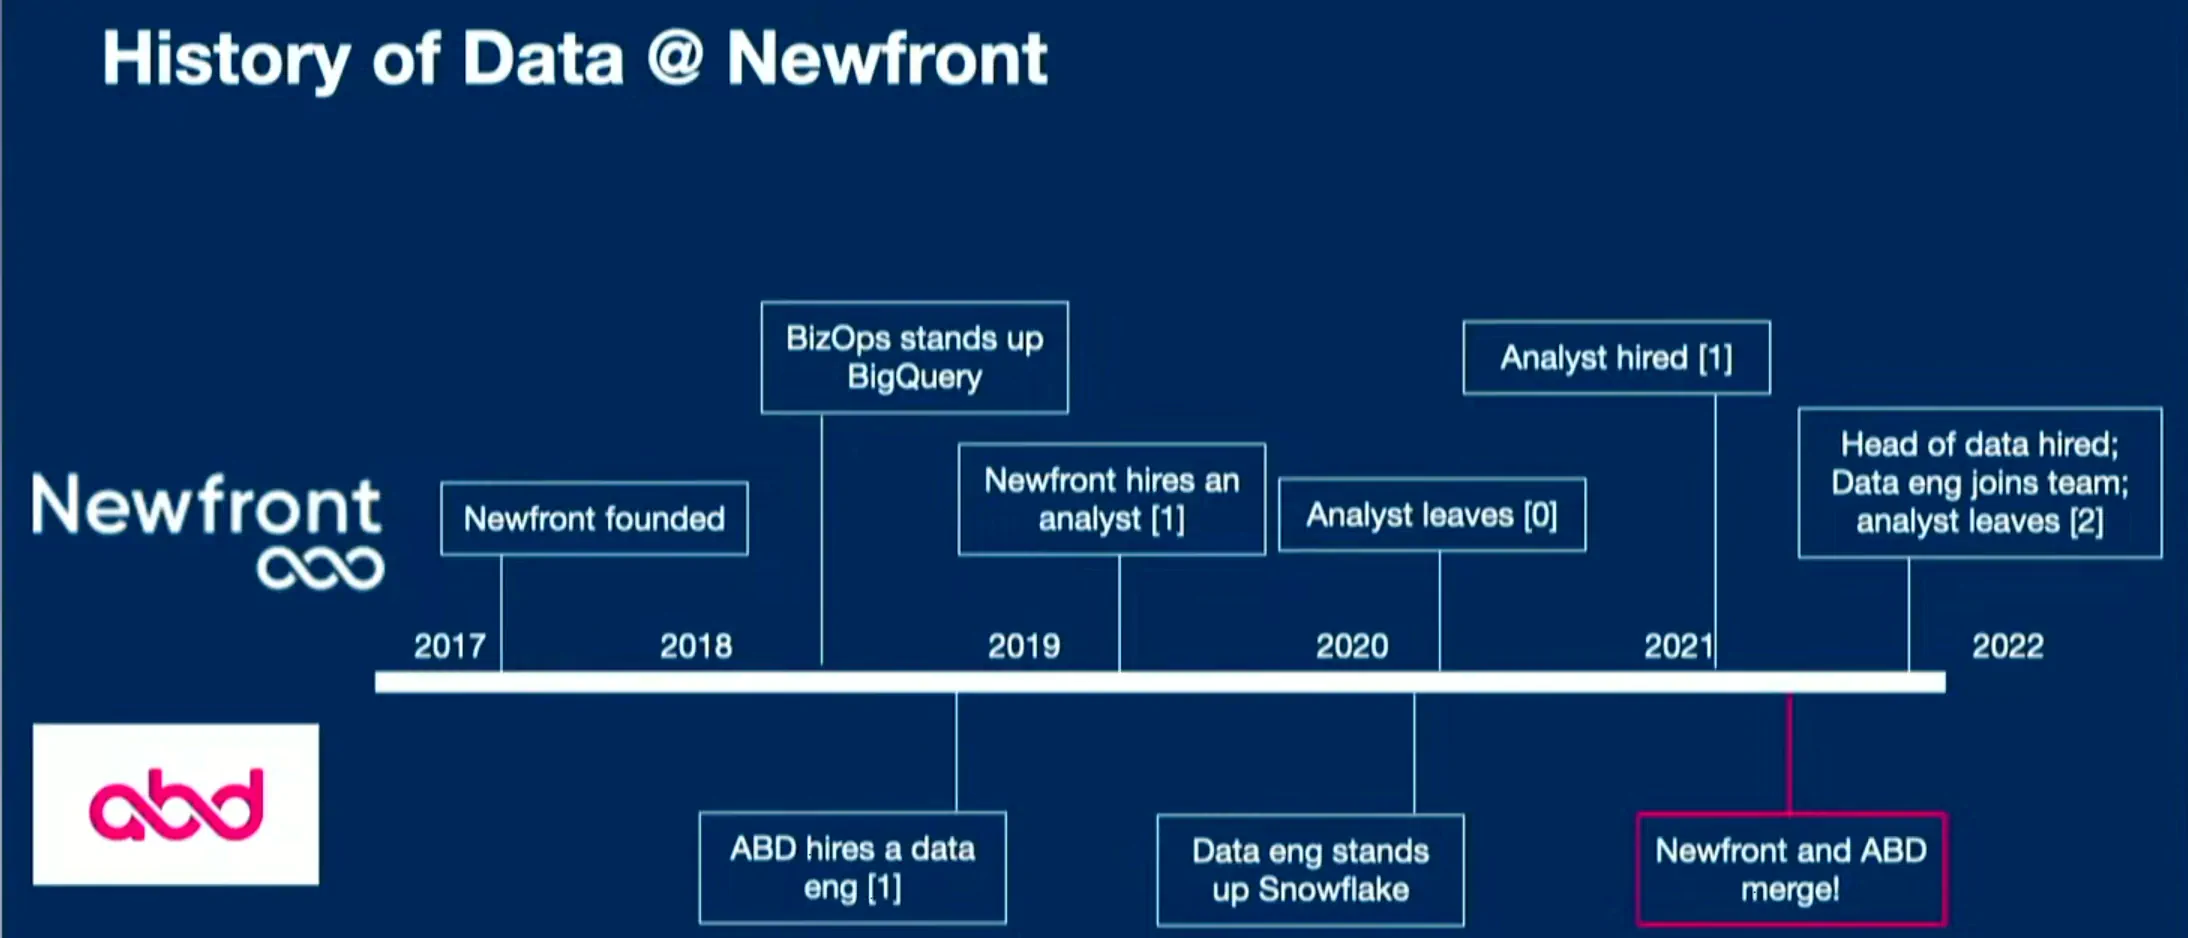
Patrick Miller, Head of Data at Newfront, talked us through “How a post-merger, 1000+ person company founded a data team”
It generally isn’t hard to find advice about building a data team from scratch in small startups. But a 1000+ people company building a data team? You don’t hear that story every day.
At Newfront, the data team wasn’t created until the Series D round. After merging with ABD in 2021, source systems exploded making it almost impossible for employees to access reliable or timely data anymore. As you can imagine it was time to bring data professionals into the picture. Now, what’s the recipe for taking a legacy company with poor data maturity into one that can deliver data products to its clients?
We learned from Patrick that succeeding in this endeavor takes a first-year strategy based on three pillars:
First, learn as quickly as possible. Your first 30/60 days are about meeting 15 people per week, identifying key players, finding data champions, and building a personal relationship with them. It’s always easier making a proposal involving data when you have champions (i.e: people who think that data is key to the business, and who will cheer the manager for your initiative)
Second, establish credibility through early wins. Establish early wins in one or more of these areas: Data engineering (e.g: a successful migration), Analytics (e.g. Look for areas where management can’t make a data-fueled decision, and allow them to make one), and Data Product (e.g prototyping).
Finally, build a strong data team. When building your team, there are three things you should keep in mind: culture and value fit, transparency about the data situation of your company, and hiring senior data generalists first.
Building a team is one thing, justifying investment in it is another. The second talk I found eye-opening was Chetan Sharma’s “Data teams v. The recession,” which was a talk about justifying investment for your data team. As the prior Chief Data Scientist at Airbnb, Chatan knows a few things about proving the value of your data team. With tech stocks plummeting and the massive layoffs happening, surviving and thriving in CFO cutbacks has never been a more important topic. As a data leader, what should you be doing to justify more investment in your team? Here were three of Chetan’s tips for winning the ROI battle:
- Core business reporting. Your company needs to know its KPIs, especially in an economic downturn. And core reporting justifies a small data team. CAREFUL, as this tip is a double edge sword. Core reporting only justifies a skeleton team of data workers.
- Avoid the trap of people pleasing. ELIMINATE all data work that feels good in the moment, but that doesn’t provide a good story for your CFO later. This is data work related to low-consequence decisions, such as answering questions like “How many users look at my widget and then make a purchase?” or questions of the type. In general, your data answer will not change the decision. Let go of the people-pleasing times and organize for people to self-serve these answers.
- Directly drive decisions that affect revenue. In contrast, some decisions are high consequence and heavily data-driven. Instead of people pleasing, there are three strong candidates for data investment you should consider: marketing optimization can save you millions in expenditure a year, product experiments can prevent you from launching a product doomed to underperform, and cost center reduction such as prioritizing high-value CX tickets can improve large operational costs.
I’ll stop here for the sake of digestibility, but I wish I could transcribe every word Chetan said. Such a good talk, filled with great Airbnb examples. can’t recommend enough.
Data Governance
Data Governance was on a lot of coalesce folks’ minds. Tools like dbt have empowered more people to create data models (which is great), but this has inevitably led the Data Warehouse to be more chaotic. Inevitably, more organizations are making Data Governance a priority. I’m all for it, and believe that good data management is the foundation of every sustainable data endeavor. There were a lot of talks about the matter, and I’ve summarized here the two I have found the most relevant.
I loved “More metadata, less problems” from Kevin Hu (Metaplane) and Marion Pavillet (MUX) about scaling data stacks in large companies. In particular, Marion took us through the story of scaling PublicCo, from 1500 to 3000.
In Marion’s view, there’s a blessing and a curse associated with modern data & analytics. On the one hand, assembling data stacks is easier than ever. On the other, this has created a huge amount of complexity. It’s hard to keep track of what’s going on in the data warehouse. More data + more users + more queries= chaos.
Growing your data warehouse means three things: more time and turnover, more people looking at the data and relying on it, and more tables and queries.
What’s the solution to overcome these challenges? Metadata. Looking into the metadata helps a lot in the process of growing the data warehouse and being more sure of how things are.
Metadata allows you to:
- Detect data anomalies before others.
- Optimize the queries that take the longest.
- Educate other stakeholders and assist with queries.
- Clean up your warehouse by removing or archiving unused tables.
Hands up for metadata!
Kevin then took on to show how Metaplane can leverage metadata to solve these challenges. I’ll let you watch this part on your own.
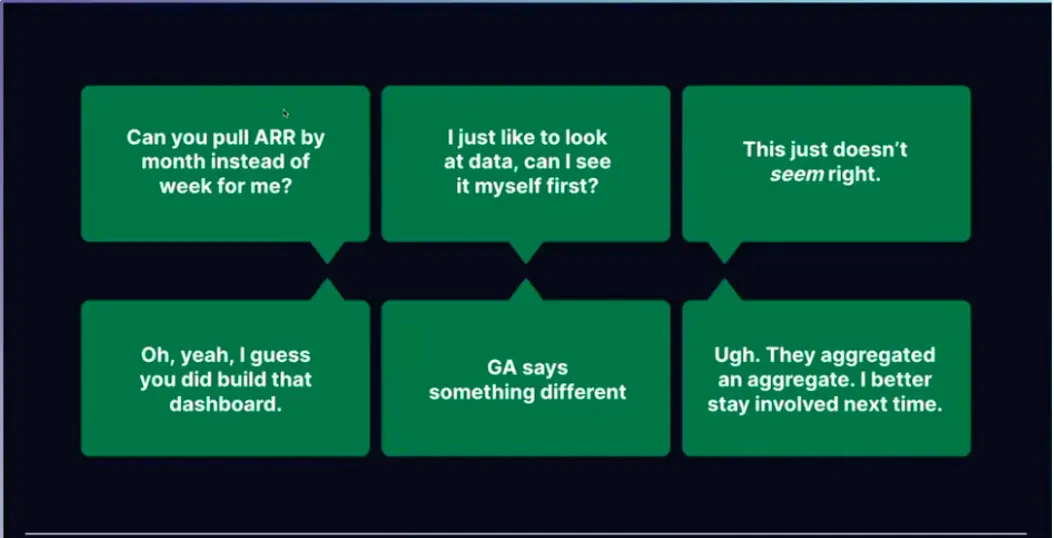
Another key topic in the space is misalignment around metrics. As an ecosystem, we still haven’t found the magic trick for metrics. I attended a great talk about the topic by Emily Ritter, VP of marketing at Mode: “But my number says this… and other horror stories”. This talk was about getting the metrics creation process right to ensure long-lasting, company-wide alignment around them.
Emily proposed approaching metrics definition like a “superorganism”. A superorganism is ”a group of synergetically interacting organisms of the same species”.The key characteristic of superorganisms is collective intelligence, which is the fruit of collective reasoning between specialists. This is what usually happens when your organization is not approaching metrics definition like a superorganism.
Now, how do you bring collective intelligence together?
Dbt just released the semantic layer to be the standard for metrics definition. It’s great, but the metrics have to be right. Being right means that they reflect the business and everybody’s understanding of what those metrics mean. Before codifying your metrics in dbt, take the time to be curious and bring your business team to partner with you in defining these metrics. You need domain expertise if you want to bring those metrics to life. here’s how Emily suggested doing it:
- Start by tapping into everyone’s knowledge to build a shared vision of metrics. Slow down to go fast. For example, get the Marketing team in when defining the term “lead” before codifying it.
- Strengthen the team. Ensure you have a healthy team. Do so by focusing on psychological safety, Dependability, Structure & clarity, Meaning, and Impact. It’s not about the smartest person on the team, it’s about the group getting smarter together.
- Iterate together, and stay fresh. Be involved in the product development process upstream of writing code. Make sure the right people are in the room as you’re planning more initiatives. Ensure you don’t miss domain expert’s input.
Data Apps
Data Apps.. where to begin? Data apps are a way to leverage your warehouse beyond simply conducting BI, for high-value operational use cases. Data apps are definitely a thing, and I’ve been wondering about them for a while. Coalesce was a good occasion to learn about them.
“Preparing for the next wave: Data Apps” by Robert Harmon and Jay Rajendran took my understanding of Data Apps a step further. The talk went over what Data Apps were and the features they should display. Let’s go.
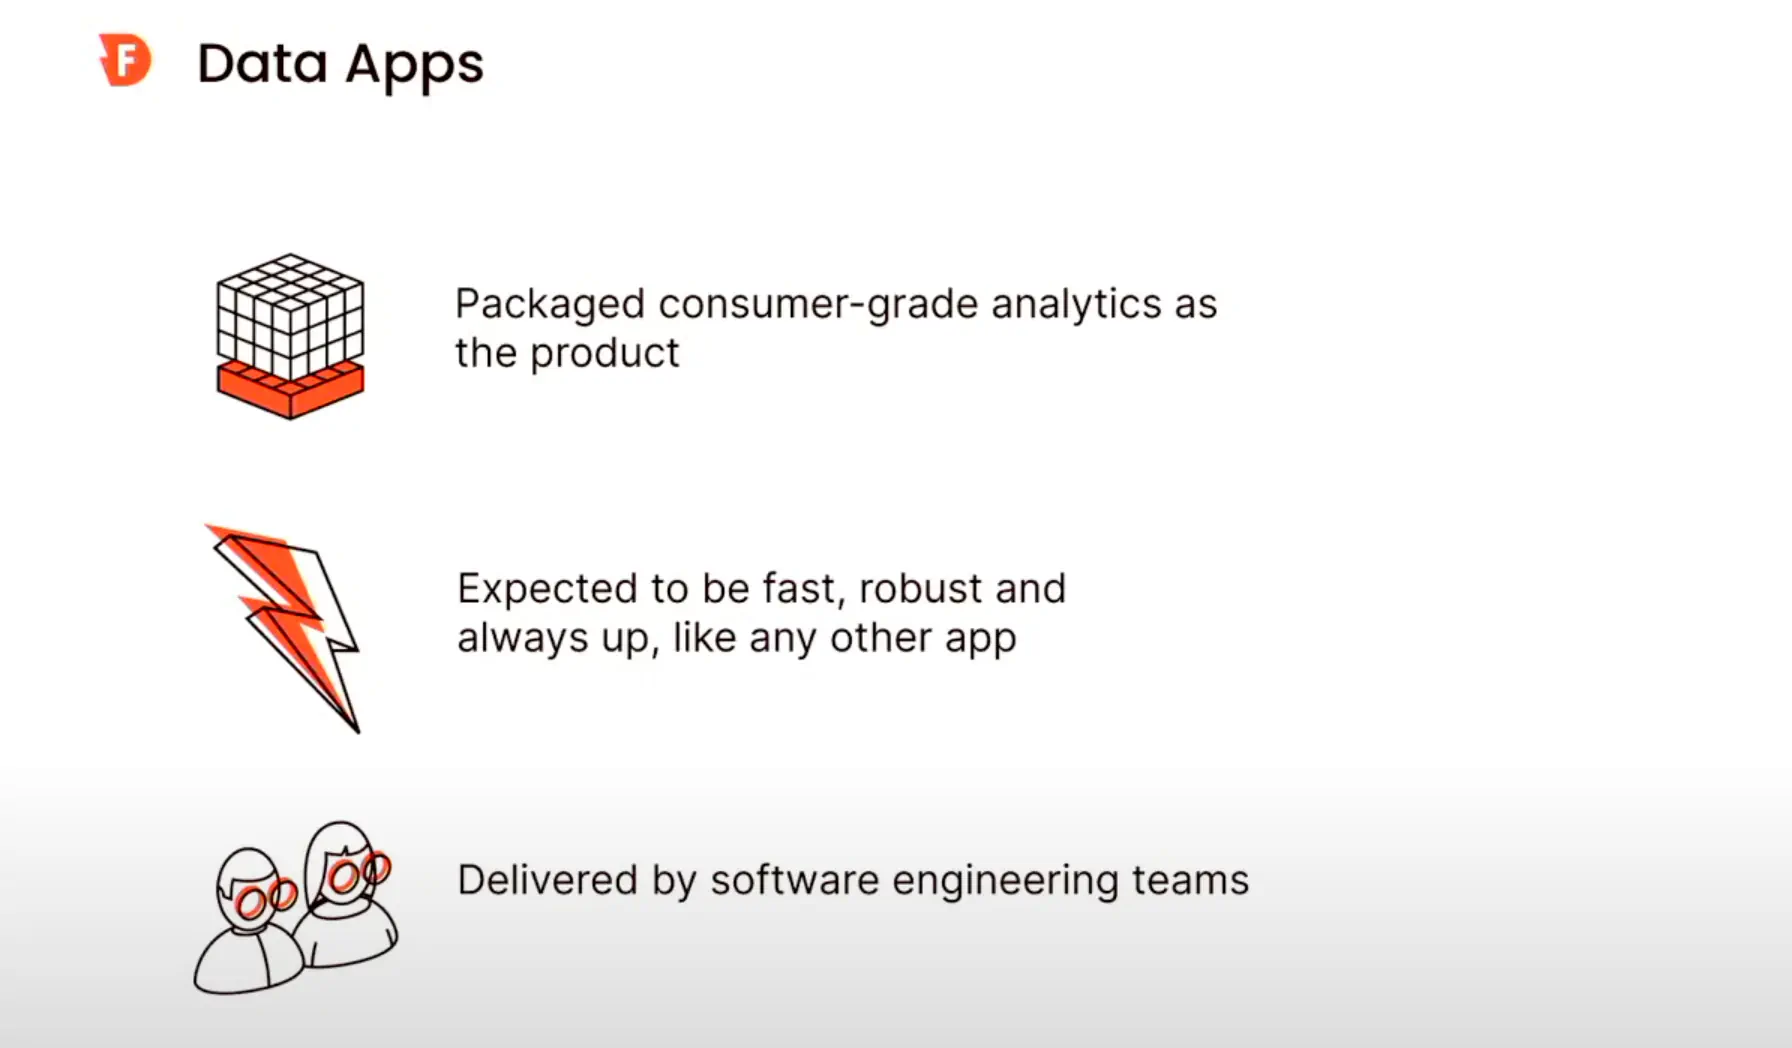
Data Apps are production applications built on top of the data warehouse. It makes sense to build Data Apps on top of the warehouse, as it’s usually the single source of truth for data in organization. According to Robert and Jay, Data Apps should display the following features:
- A packaged experience. Data Apps should be purpose-built for a specific use case customers are looking to tackle.
- Performance is fast, robust, and always up. Just like a phone application. User expectations for data apps are high. A few seconds is too slow. You need to ensure your queries run damn fast.
- Delivered by software engineering teams. Traditional BI is provided by BI teams. A different mindset needs to come in with Data Apps, which should be built by engineers.
However, there is a bump in the road to building strong data apps. You need to deliver the data incredibly fast to the warehouse (remember, your app should respond fast), which is highly demanding on the data infrastructure. As data volumes increase, providing a good response time gets harder.
We learned the solution lies in having a rock-solid data warehouse and making compromises. A robust data warehouse contains healthy data and doesn't compromise on data quality. This way, it is more likely to handle the Data App workload. Even when this box is ticked, Data App builders have to compromise to allow the app to run fast:
- Aggregate data into summary tables in lengthy jobs, losing granularity and freshness.
- Analyze smaller time windows, losing depth.
- Slow dashboards that frustrate users.
- Glue together multiple-point solutions in complex engineering projects.
The more performant your warehouse, the less you will have to compromise. Robert explained how Firebolt allows for building Data Apps while minimizing the need for compromise. The talk also covered techniques you can use to optimize your Data Apps, so don’t hesitate to dig further if you’re interested.
I also really enjoyed “Data Apps in the real world: How to capture value locked in the Data Warehouse” which covered the practical, hands-on side of Data Apps. The talk featured Tejas Manohar (Hightouch), Kevin Chao (Ramp), and TJ Murphy (Multi Media, LLC.)
Why would you want to build Data Apps? Well, the data warehouse has become the richest data source in companies, and your data is useful for more than BI. For example, you can use it for operational use cases around the company. How does that work in practice?
TJ Murphy used to work at Minted, an e-commerce company selling Christmas cards, wedding invitations, etc… He reported building data apps for every department in the company. TJ shared tips and best practices if you’re thinking about doing Data Apps:
- Clean data is valuable data. Invest in making your data right, it builds trust and enables great reporting.
- Data Apps are more than just Machine Learning. You don’t need a fully-fledged data science team to get started. Your analytics team is enough.
- Think about intersections. Today, we have more interconnected systems than ever before. Use this interconnectedness to create value within your app.
- Stay flexible. You can build Data Apps for more departments than Marketing and Growth. TJ built Data Apps for the fulfillment department and it had a tremendous impact.
- Follow the value. Data Apps thrive around centers of value creation. Think about where you can deliver more value and build your Data App there.
Kevin Chao, Sr Analytics Engineer at Ramp also recounted how Ramp created an underwriting data application, which automated credit assessment for new Ramp applications. This was achieved using the reverse ETL tool Hightouch. If you’re interested in hearing about this use case, check the recording out!
Conclusion
I was pleasantly surprised to hear such good voices about these crucial topics. The purpose of gathering the data community in one place is to collectively progress on these complex topics. The conference was also a great way of understanding the key innovations in the space and how to implement them efficiently. It’s refreshing to hear the experience of people who’ve walked the walk. All in all, I’ve returned to my regular life energized and enlightened on many topics. I’m looking forward to Coalescing in San Diego next year!
Subscribe to the Castor blog
About us
We write about all the processes involved when leveraging data assets: from the modern data stack to data teams composition, to data governance. Our blog covers the technical and the less technical aspects of creating tangible value from data.
At Castor, we are building a data documentation tool for the Notion, Figma, Slack generation.
Or data-wise for the Fivetran, Looker, Snowflake, DBT aficionados. We designed our catalog software to be easy to use, delightful and friendly.
Want to check it out? Reach out to us and we will show you a demo.
.png)
You might also like


Get in Touch to Learn More


“[I like] The easy to use interface and the speed of finding the relevant assets that you're looking for in your database. I also really enjoy the score given to each table, [which] lets you prioritize the results of your queries by how often certain data is used.” - Michal P., Head of Data
